The Power of Visual Storytelling: Communicating the Circus of Data

This week’s newsletter introduces our Creative Studio team Lisa Vissichelli and Danica Barnes, who work their magic bringing our client’s research findings to life, allowing them to better engage stakeholders and embed new frameworks and insights across their business.
Below, they share five ways the Incite Creative Studio transforms deliverables without compromising data.
Picture this, you’ve invested in research to better understand your latest customer offering. But, all you have are pages of data – unsorted and lacking a clear narrative. You start to wonder: how do I share this story so that it resonates? How do I transform what I’ve learned to get buy-in within my team and within my organization?
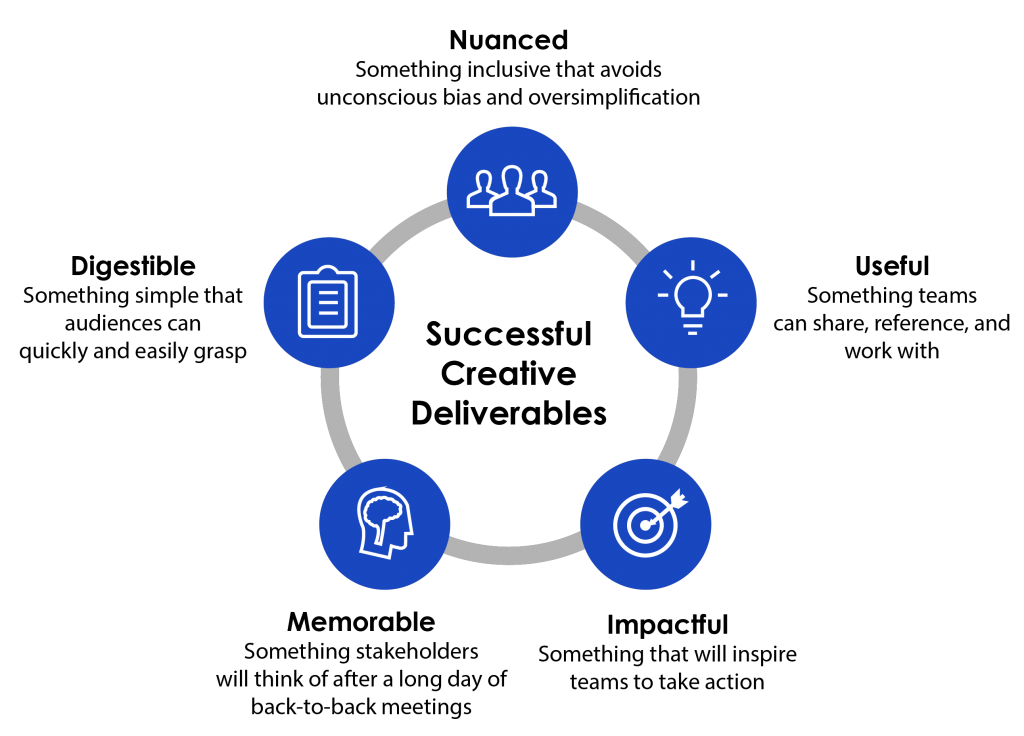
Presenting complex data and insights can feel like taming a wild beast. It can be tempting to simplify findings into punchy stats, but this can lead to losing sight of the greater research story.
The true beauty of a data story is embracing what makes it intimidating and putting on a show with an elevated visual story.
Only 70% of people can remember content presented verbally, and on average, people need around six seconds to read 20-25 words. While that doesn’t seem like a lot of time, when you compare it to the ¼ of a second they need to process a picture, it becomes a lot more obvious how powerful the latter is.
This is why it is critical to pair research reports with visual and multimedia deliverables, as they can bring research stories to life in ways words and stats often cannot. To be successful, creative deliverables must be:
Here are five techniques our Creative Studio use to unleash great deliverables:
1/ Embrace the “circus of data.”
“Every component of a visual can shape how our clients empathize with their customers,” shared Lisa Vissichelli, Head of Visual Design at Incite.
“It’s important that deliverables take into account more than just a demographic profile and give us a richer understanding of these people’s needs and mindsets.”

By going deeper than surface level and diving into the “circus of data,” we produce visual and multimedia deliverables that are more inclusive and more relatable.
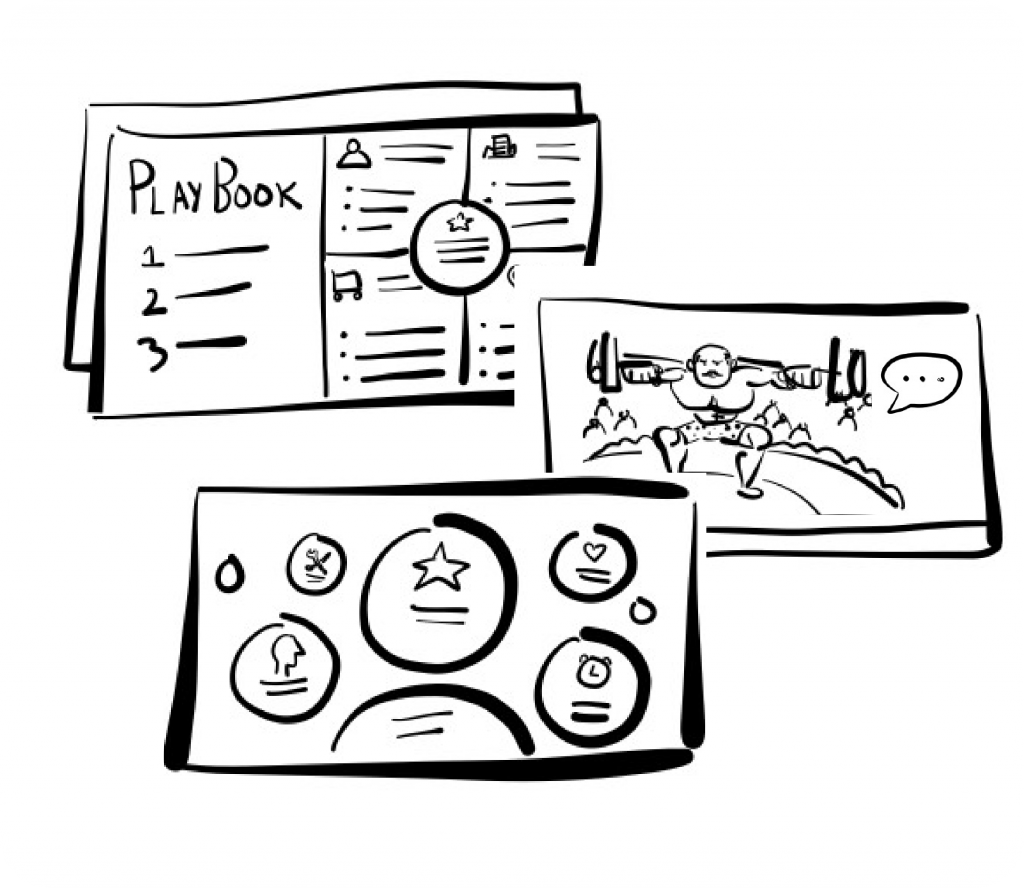
Some examples include:
- High-fidelity reports: final presentations that include 30+ slides of diagrams, micro-infographics, stimuli, and contextual visual stories
- Video clip banks: libraries of 20-30 interview clips showcasing a broad range of respondents
2/ Don’t bore us. Get to the chorus.
“It’s definitely important to be nuanced, but you don’t need to include every bit of information in a video or design deliverable,” said Danica Barnes, Multimedia Specialist at Incite.
“You have to balance being specific with being simple.”
Short, succinct deliverables can pique an audience’s interest and inspire them to dive into our research reports.
We achieve this effect through:
- Executive level infographics and playbooks: short-form marketing materials to share across an organization
- Video highlight reels: 1-3 minute videos conveying the key insights from a study
3/ Don’t you forget about me.
“When you spend your whole day listening to presentations, you don’t remember the stats and the findings. You remember the people, and you remember the stories,” Danica explained.
According to researchers Chip and Dan Heath, in their book Made to Stick 63% of people remember stories after a presentation but only 5% can remember a single stat.
This is why we wrap all of our creative deliverables in clear, human-centric narratives.
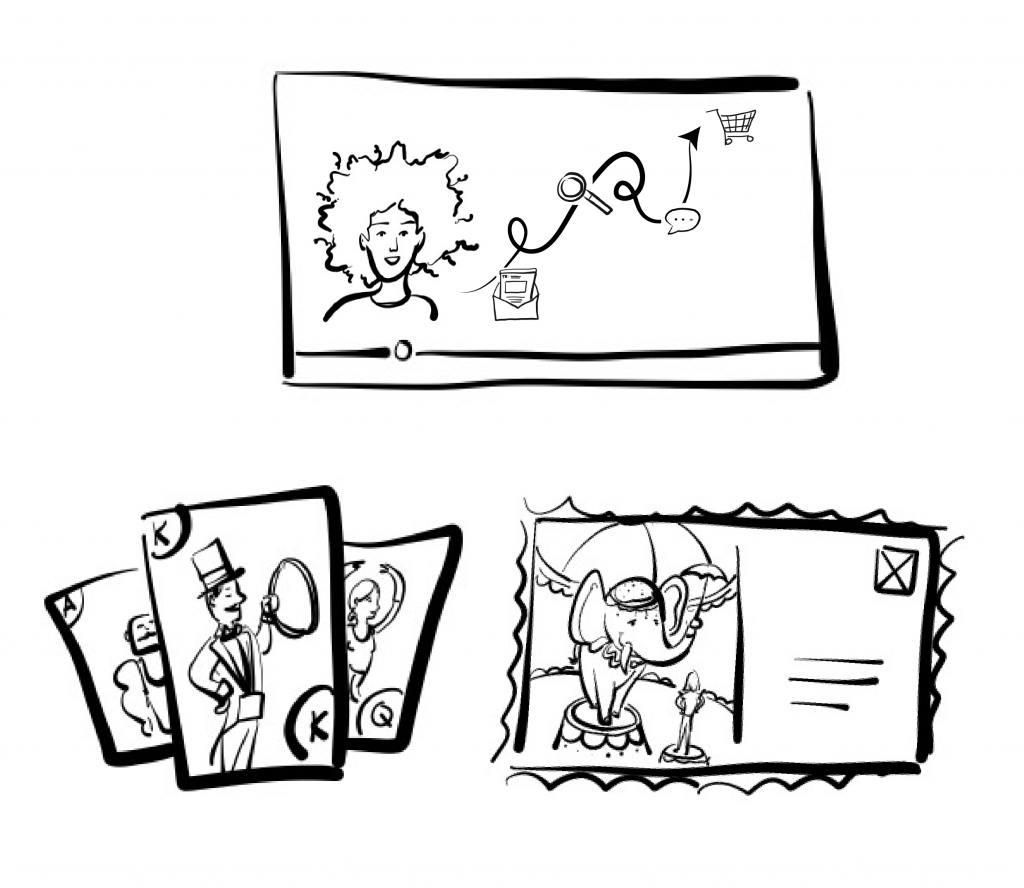
Our most story-driven deliverables include:
- Participant point of view storytelling: visual interpretations of participant stories, creative exercises, and concepts
- Narrative videos: 3-5 minute videos exploring respondent pain points, wants, and needs
4/ Show me a hero.
“Bringing research to life is more than just adding an image or a video,” said Lisa. “It’s about creating an experience that outlives the project.”
By giving audiences a person to root for or a cause to rally behind, we create deliverables that push people to action and inspire them to share the message with others.
We make an impact with:
- People-first deliverables: pen portraits and experience maps that bring to life participant mindsets and needs in the context of business objectives
- Immersive videos: ethnographic videos profiling key customers (your “heroes”)
5/ Give them the old Razzle Dazzle
Even with custom, high-quality visuals, the way they’re delivered can transform their impact. We can only unlock opportunity if we communicate in a way that resonates with clients and if we give them deliverables they can actually use.
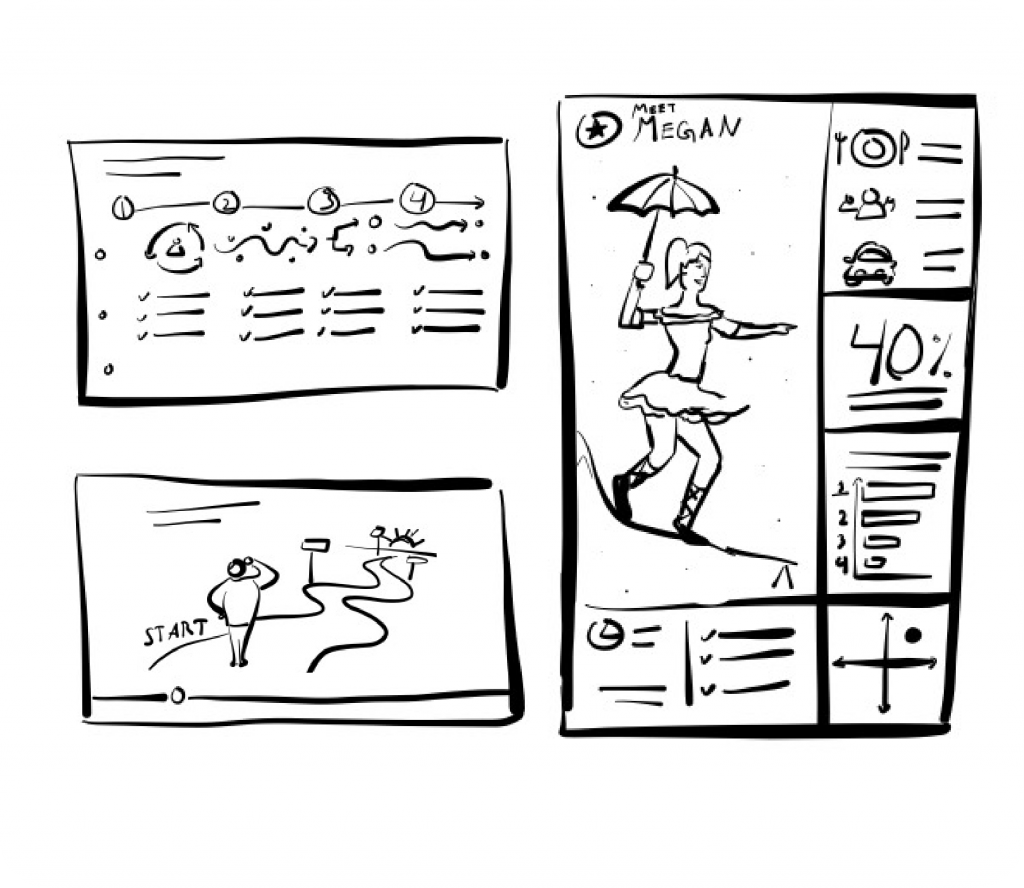
Communicating research requires a visual language that can not only cut through the chaos of data but can also transform how people work together. We put on a show with:
- Strategic presentations: webinar-style presentations that showcase insights with show stopping builds, data stories and bite-sized narratives
- Interactive microsites: internal, mini-websites that can introduce an organization to new research initiatives and findings
At Incite, we are always exploring new, innovative ways to unlock opportunity through our visual storytelling.
The Incite Creative Studio handles design and video efforts at all stages of research – from stimulus for testing to report design and data visualization.
With over 15 years experience in research, design, and multimedia, they excel at visual storytelling and building custom assets that engage, inspire, and create a lasting impression within your team and your organization.
To learn more about the Incite Creative Studio, download their capabilities one pager below.

")
")
")
")